
Arpiar Saunders
Postdoctoral Fellow
Psychiatric illness and neural circuits


Laura Bortolin
Research Associate
Laura_Bortolin@hms.harvard.edu
Single-cell analysis technology

Fenna Krienen
Postdoctoral Fellow
fenna_krienen@hms.harvard.edu
Primate brain transcriptomics, development, evolution

James Nemesh
Computational Biologist
Data Janitor

Matthew Baum
Graduate student, Neurobiology
Complement inhibitors in psychiatric illness
Elizabeth Bien
Scientific Staff
Single-cell analysis technology
Melissa Goldman
Scientific Staff
Single-cell analysis technology

Sara Brumbaugh
App Designer
Nolan Kamitaki
Computational Biologist
Math, genomics, and biology

Alec Wysoker
Software Engineer
Single-cell computational analysis

David Kulp
Data Scientist
DropViz app developer
DropViz
Exploring the Mouse Brain through Single Cell Expression Profiles
The mammalian brain is composed of a vast (and unknown) number of specialized cell types whose complex interactions underlie behavior. To better appreciate these cellular specializations — and the genes that cells of diverse types use to perform their jobs — we used Drop-seq to analyze 690,000 individual cells from nine different regions of the adult mouse brain. We identified 1.45 billion RNA transcripts among these cells, then used the cells' patterns of RNA expression to classify them into transcriptionally distinct groups of cells (clusters and subclusters). Most of these clusters and subclusters correspond to discrete cell types; some to dynamic cell states; and many, we expect, to aspects of cell biology that remain to be discovered.
Explore Cell Types
The expression profile for each cell was grouped into clusters and sub-clusters through a semi-automated process and the results were projected onto 2-D t-SNE plots to visually approximate the expression relationships amongst individual cells. Gene expression levels of query genes can be overlayed on any subset of data.
Compare and Discover Genes
The relative pairwise gene expression between cell types within a region or across different regions can be quickly computed for 10,000s of genes and ranked to identify distinguishing marker genes. Additional user selected genes can be added to the comparison set.
Search By Gene
Enter one or more genes of interest to immediately see the relative gene expression across 262 cell types.
Example: The twenty cell types with the highest expression of S100a6 across all brain regions.
We hope you find this data resource useful. Please write us with experiences and suggestions. We would love stories about how people are using it in their work.
Drop-seq
Drop-seq is a technology we developed for highly parallel analysis of RNA expression in thousands of individual cells. Drop-seq works by encapsulating individual cells into vast numbers of nanoliter-sized droplets, together with DNA-barcoded beads that uniquely identify the droplets. We described Drop-seq in a paper in 2015, and subsequent commercial technologies have been built on this approach. We have made Drop-seq open-source, and hundreds of labs have adopted it; detailed protocols and software are available on the Drop-seq web site.
Summary
The mammalian brain is composed of diverse, specialized cell populations. To systematically ascertain and learn from these cellular specializations, we used Drop-seq to profile RNA expression in 690,000 individual cells sampled from 9 regions of the adult mouse brain. We identified 565 transcriptionally distinct groups of cells using computational approaches developed to distinguish biological from technical signals. Cross-region analysis of these 565 cell populations revealed features of brain organization, including a gene-expression module for synthesizing axonal and presynaptic components, patterns in the co-deployment of voltage-gated ion channels, functional distinctions among the cells of the vasculature and specialization of glutamatergic neurons across cortical regions. Systematic neuronal classifications for two complex basal ganglia nuclei and the striatum revealed a rare population of spiny projection neurons. This adult mouse brain cell atlas, accessible through interactive online software (DropViz), serves as a reference for development, disease, and evolution.
Citation
Saunders A*, Macosko E.Z*, Wysoker A, Goldman M, Krienen, F, de Rivera H, Bien E, Baum M, Wang S, Bortolin L, Goeva A, Nemesh J, Kamitaki N, Brumbaugh S, Kulp D and McCarroll, S.A. 2018. Molecular Diversity and Specializations among the Cells of the Adult Mouse Brain. 2018. Cell. 174(4) P1015-1030.E16 (DOI)
Funding and Support
This research was performed in the McCarroll and Macosko Labs at Harvard Medical School and the Broad Institute's Stanley Center for Psychiatric Research.


Cluster Levels
The plot displays the relative expression of the selected gene(s) among clusters. The error bars represent binomially distributed sampling noise given the number of cells in each cluster; it does not represent heterogeneity in expression among cells within the cluster. Only clusters filtered in the Query panel are displayed. The plot is limited to only two entered genes. If more than two genes are chosen, then the display switches to a heatmap-like table.
Cluster Levels (Heatmap Table)
The table displays the relative expression of the selected gene(s) in all clusters using a shaded dot. Darker dots represent higher gene expression. Only clusters filtered in the ',b('Query'),'panel are displayed. Mouseover dots to display numeric values or choose the download icon to retrieve the full table data in R. The table is displayed when more than two genes are chosen.
Help for t-SNE plot of clusters in global region space.
Each point represents a single cell. Each cell is associated with a gene expression vector. This high-dimensional data is reduced using a set of automated independent components and projected onto two dimensions using t-SNE ('global space', i.e. representing all cells from a brain region/tissue). The cluster classifications are derived from Louvain clustering of the ICs.
Points are generally sub-sampled to improve display and speed rendering. Sampling can be controlled using the Display panel on the left. 'Bag' plots show the distribution of all points similar to a one-dimensional box plot. The darker region represents 50% of cells. The lighter region represents all points except outliers.
Clusters are highlighted in different colors based on the filtering choices in the Query section in the left panel. Labels and other display features can be customized in the Display panel
If a row in the differentially expressed genes table, below, or one or more genes are entered by name in the Query panel to the left, then the selected genes' expression levels will be displayed in black (one row of t-SNE plots per gene) and the mean expression level for that gene in the subcluster is displayed by a color gradient or transparency, depending on settings.
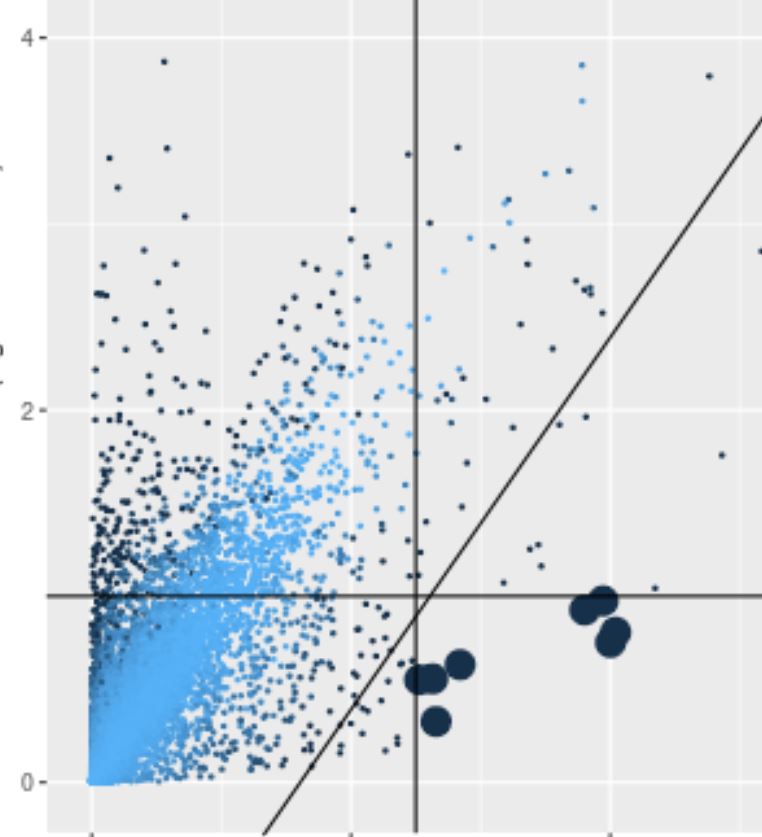
Cluster scatter plot
Each point is the mean log normalized transcript count among all cells in the target and comparison clusters (or region). Large points meet the fold ratio and transcript amount criteria in the Clusters panel. Points are shaded according to their significance. Selected rows in the table of differentially expressed genes are displayed in green or red depending on whether they pass the criteria.
Differentially expressed genes in clusters
Select a 'target' cluster in the left Clusters panel to display those genes that are over-expressed in that cluster with respect to the remaining cells in the region or a chosen comparison cluster. Adjust filter criteria using the Clusters panel.
Any manually added genes are always displayed in the table and colored green if the expression criteria is met and colored red otherwise.
One or more rows can be selected to display gene expression in the t-SNE and scatter plots.
Subcluster Levels
The plot displays the relative expression of the selected gene(s) among subclusters. The error bars represent binomially distributed sampling noise given the number of cells in each subcluster; it does not represent heterogeneity in expression among cells within the subcluster. Only subclusters filtered in the Query panel are displayed. The plot is limited to only two entered genes. If more than two genes are chosen, then the display switches to a heatmap-like table.
Subluster Levels (Heatmap Table)
The table displays the relative expression of the selected gene(s) in all subclusters using a shaded dot. Darker dots represent higher gene expression. Only subclusters filtered in the Query panel are displayed. Mouseover dots to display numeric values or choose the download icon to retrieve the full table data in R. The table is displayed when more than two genes are chosen.
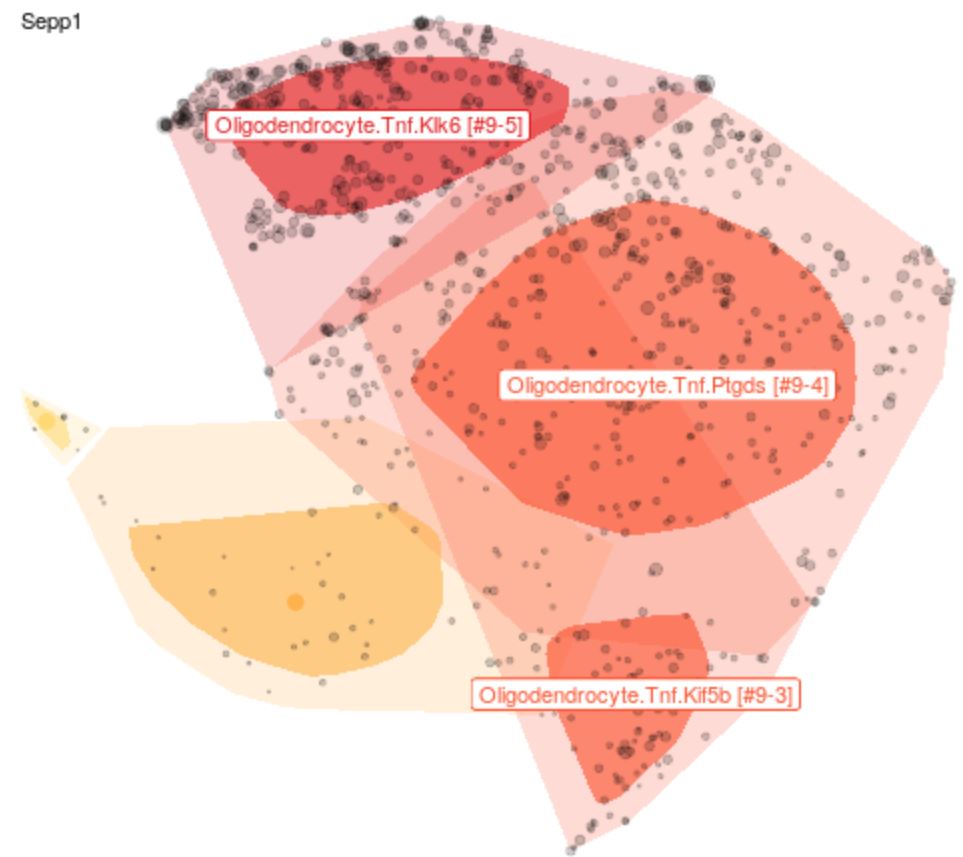
Help for t-SNE plot of subclusters in local cluster space.
Each point represents a single cell. Each cell is associated with a gene expression vector. This high-dimensional data within a cluster is reduced using a set of curated independent components and projected onto two dimensions using t-SNE ('local cluster space'). The subcluster classifications are derived from Louvain clustering using a subset of the ICs.
Subcluster regions are highlighted in different colors based on the filtering choices in the Query section in the left panel. All points in the corresponding cluster are displayed with points outside of the chosen subcluster(s) shown in gray and all points in the chosen subclusters displayed in color. (There is no subsampling for subcluster displays.)
If a row in the differentially expressed genes table, below, or one or more genes are entered by name in the Query panel to the left, then the selected genes' expression levels will be displayed in black (one row of t-SNE plots per gene) and the mean expression level for that gene in the subcluster is displayed by a color gradient or transparency, depending on settings.
Labels and other display features can be customized in the Display panel
Subcluster scatter plot
Each point is the mean log normalized transcript count among all cells in the target and comparison subclusters (or region). Large points meet the fold ratio and transcript amount criteria in the Clusters panel. Points are shaded according to their significance. Selected rows in the table of differentially expressed genes are displayed in green or red depending on whether they pass the criteria.
Differentially expressed genes in subclusters
Select a 'target' subcluster in the left Clusters panel to display those genes that are over-expressed in that subcluster with respect to the remaining cells in the region or a chosen comparison subcluster. Adjust filter criteria using the Clusters panel.
Any manually added genes are always displayed in the table and colored green if the expression criteria is met and colored red otherwise.
One or more rows can be selected to display gene expression in the t-SNE and scatter plots, above.
Data Downloads
- Metacells
-
Gene expression profiles of the 565 transcriptionally distinct cell populations identified across nine regions in the adult mouse brain. Each column is a "metacell." There is one metacell for every subcluster, which contains the aggregate UMI counts for all the single-cells that belong to that subcluster.
CSV: metacells.BrainCellAtlas_Saunders_version_2018.04.01.csv (40M)
R Data: metacells.BrainCellAtlas_Saunders_version_2018.04.01.rds (15M)
- Annotations
-
Annotation file for the 565 atlas cell populations. Provides the tissue of origin, cell class, formal markers, formal full name and common name (anatomical best guess) for each metacell.
CSV: annotation.BrainCellAtlas_Saunders_version_2018.04.01.csv (54K)
Excel: annotation.BrainCellAtlas_Saunders_version_2018.04.01.xlsx (83K)
R Data: annotation.BrainCellAtlas_Saunders_version_2018.04.01.rds (12K)
- Single Cell Suspension Protocol from Acute Adult Brain
- Instruction for loading DGE files
- Download the private R package of DropSeq library functions: DropSeq.util_2.0.tar.gz
- Install the R package:
install.packages('/insert_path_to/DropSeq.util_2.0.tar.gz', repos=NULL) - Load the library:
library(DropSeq.util)
- Use the loadSparseDge function. DGE will be of class "dgTMatrix"
 dge.path <- "/insert_path_to/the_raw.dge.txt.gz_file"
dge <- loadSparseDge(dge.path) - DGE By Region
- DGE By Class
To access the data in .raw.dge.txt.gz files:
Video Tutorials
Feedback
We welcome any comments, bug reports, and feature requests. Please send all feedback to mouse.dropviz@gmail.com .